


Here is the latest installment in the Charts I’m Watching series:
Breadth Indicators
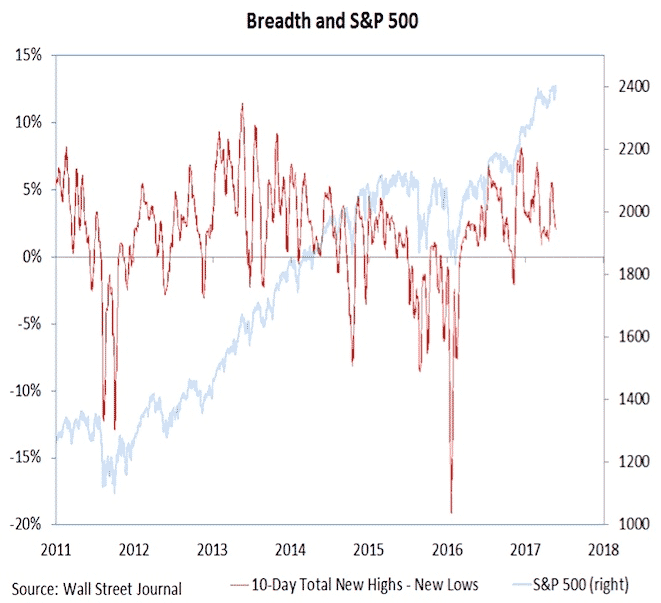
A lot of breadth indicators are currently showing weakness. Bears will argue that points to lower prices ahead. Bulls will argue the lack of participation just means there is more room for upside once more stocks start to join the rally.
Here we can see breadth clearly diverging, but as we saw in 2014, that doesn’t necessarily mean lower prices.
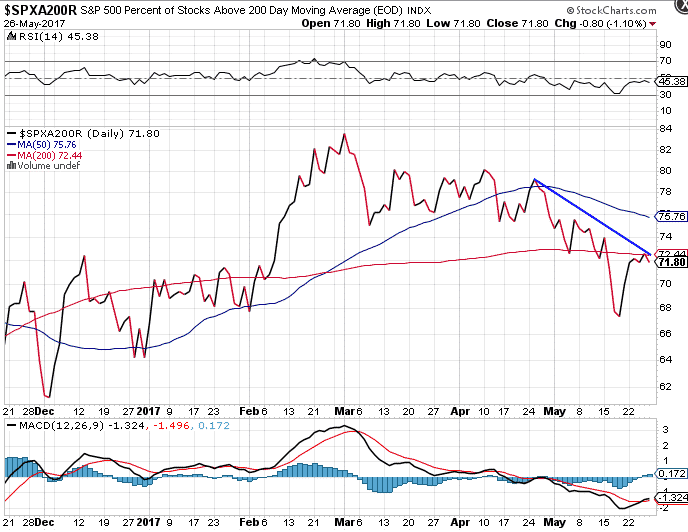
A different chart, but same concept. Stocks are making new highs, but the percentage of stocks above their 200 day moving average is declining. Does this mean there is underlying weakness and the rally is being led by a select few stocks? Or does it mean that when more stocks do get back above their 200 day average, that significant upside awaits?
The Nasdaq tells a similar story. Higher prices, but weakening momentum.

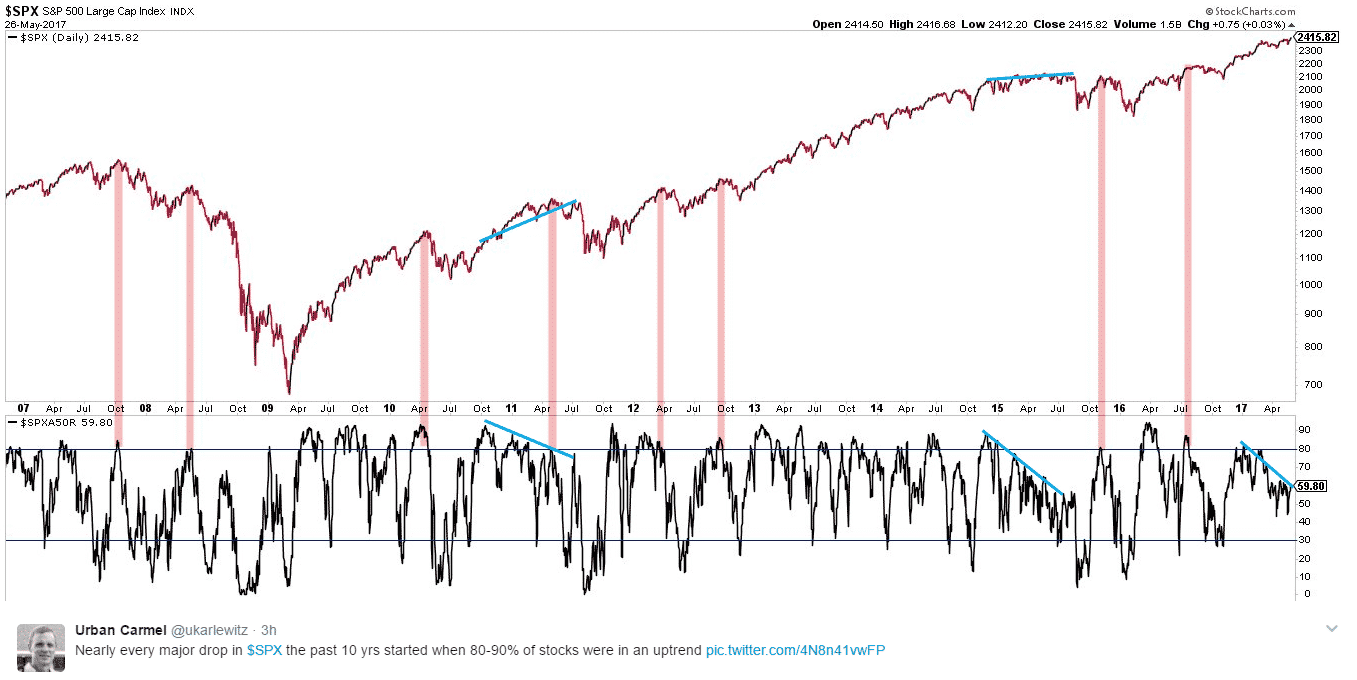
The following chart was shared by Urban Carmel. His argument is that corrections tend to happen at extremes, i.e. when 80-90% of stocks are in an uptrend.
Click Here For My Top 5 Technical Indicators
I’ve added the lines in blue. I tend to look at divergence more. When stocks move higher, but less individual names are in uptrends, big corrections follow. Two examples highlighted by the blue lines below. Where are we in the current cycle? You be the judge.
More divergence…. The one thing about divergence is it can continue for an extended time and it doesn’t matter until it does.

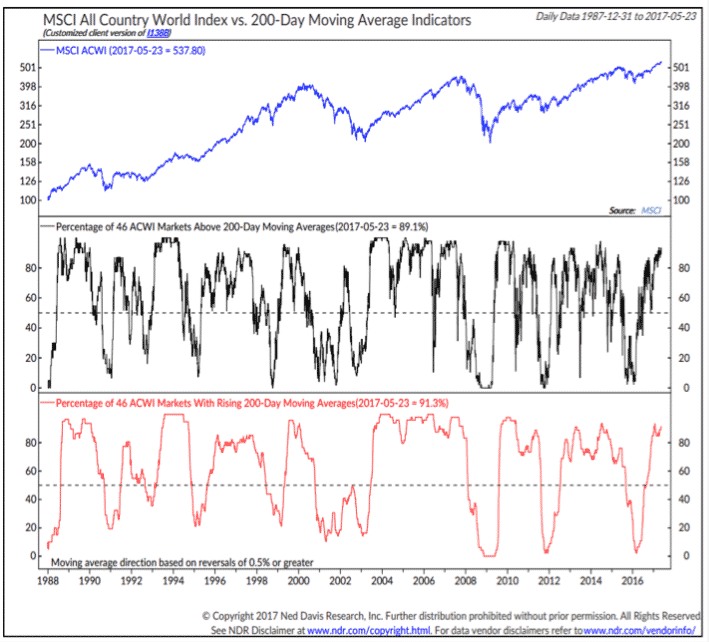
One the positive side, there is less divergence on the world scale with Europe being particularly strong which is a great sign for the global economy.
Download the Implied Volatility Calculator
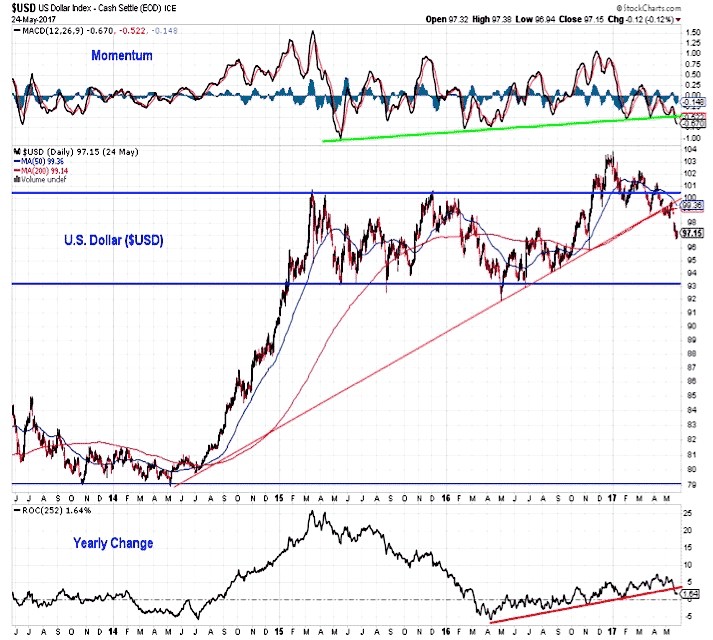
US Dollar
Can’t remember who shared this chart, but looks like the USD is potentially breaking down.
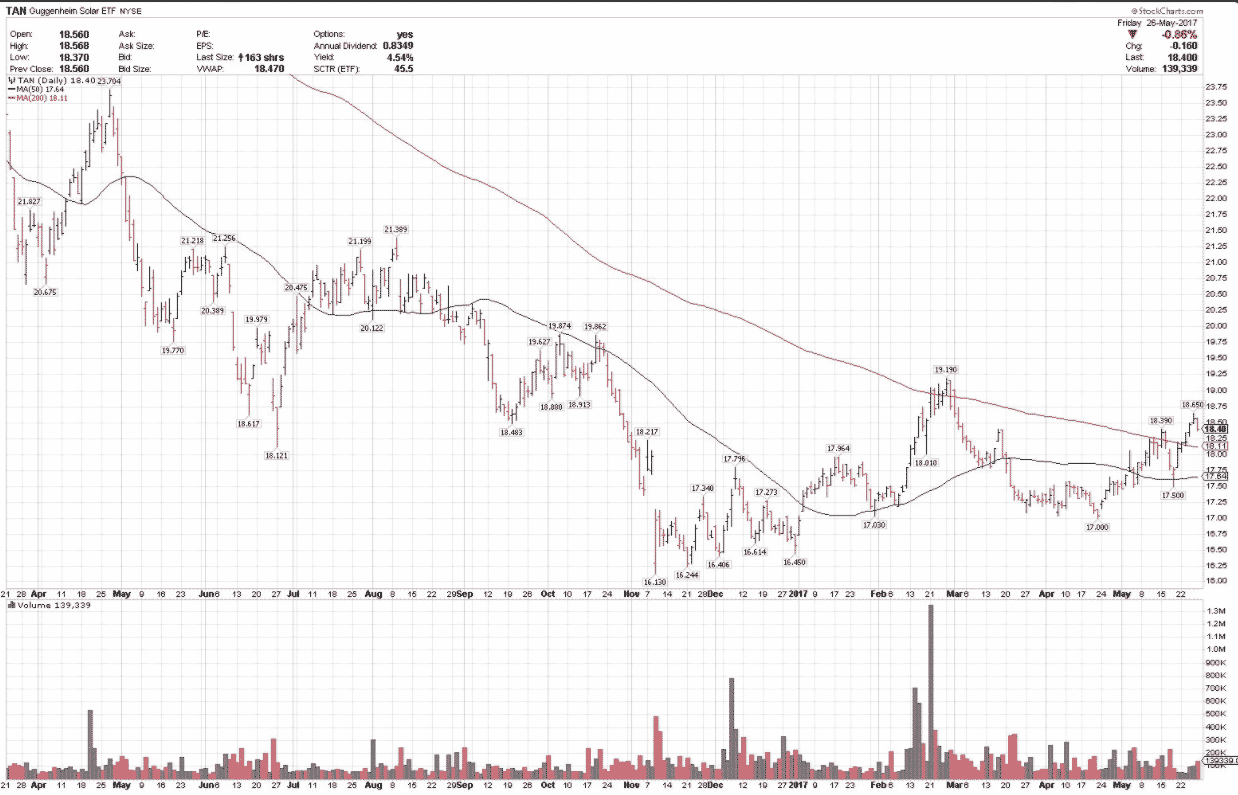
Renewable Energy
Renewable energy is starting to bounce back after a horrendous few years. With the broad based ETF – TAN clearing the 200 day moving average, could more upside be on the cards?
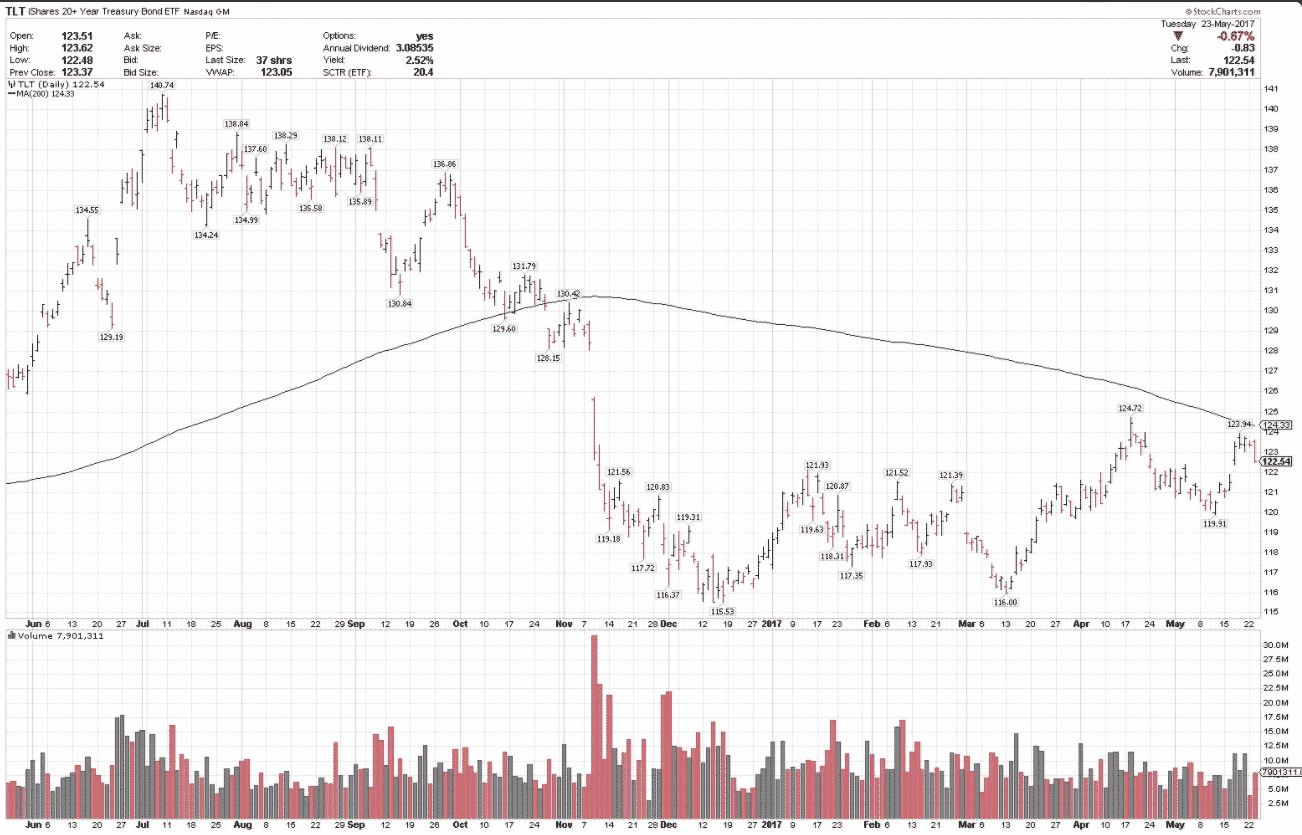
Bonds
Bonds seem to be having a hard time breaching the 200 day moving average.
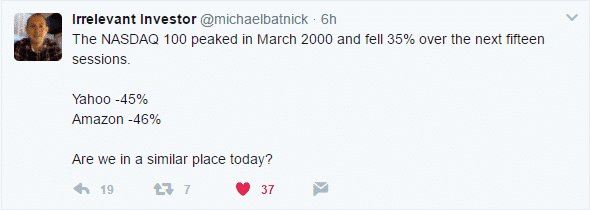
Miscellaneous
Michael Batnick chimed in this week with a timely reminder.
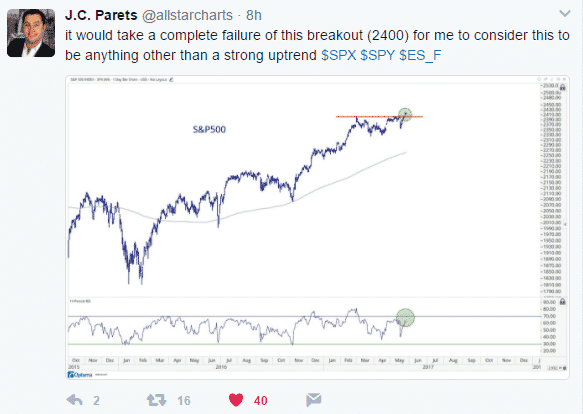
While J.C. Parets thinks it’s full steam ahead provided the S&P 500 stays above the important 2400 level.
Trade safe!
Disclaimer: The information above is for educational purposes only and should not be treated as investment advice. The strategy presented would not be suitable for investors who are not familiar with exchange traded options. Any readers interested in this strategy should do their own research and seek advice from a licensed financial adviser.


