


Contents
- Monthly SPX Butterfly
- Adding Profit Target And Stop Loss
- Narrowing The Wings
- Wider Wings
- Shorter Term Butterflies
- Longer Term Butterflies
- Varying The Stop Loss Level
- Taking Profits Earlier
- Open Next Trade Immediately
- Butterflies in Bear Market
- Technical Indicators
Butterflies comes in all shapes and sizes.
They can also be short term butterflies or longer term.
Which ones are better?
What profit target and stop loss level should we use, if any?
Let’s try to answer these questions via empirical data.
We have backtested some butterflies using CML TradeMachine Pro. Here is a summary of what the results suggest:
- A good wing width is 15-delta away from the body for both 30-DTE (days-to-expiration) and 15-DTE butterflies. Varying the width somewhat will not make a significant difference. A 20-delta wing width will also work.
- With butterflies you need to take profits early and stop losses early.
- A stop loss that is slightly larger than profit level appears to work better. Increasing the take profit level generally yields larger returns. But a larger stop loss means greater drawdown and may need to be adjusted for investor’s risk tolerance. These levels can be varied somewhat and still be profitable.
- What affects the returns to a greater degree is the market conditions and entry criteria. When those conditions are right, a larger take profit level and larger stop loss will yield better returns. When those conditions are not right, a smaller profit level and smaller stop loss will yield better returns.
- More trades does not necessarily mean greater returns. More trades when conditions are right will yield better returns. More trades when conditions are not right will yield poorer returns.
- For 30-DTE butterflies, a good take profit level is 15% and stop loss level of 20%.
- For shorter term 15-DTE butterflies, a good take profit level is 8% and stop lost of 12%. Due to increase price risk, we take profits earlier.
Following are the backtest results support these conclusions.
Monthly SPX Butterfly
Let’s simulate monthly butterflies on SPX with 30 days to expiration (DTE).
We set the short strikes at 50 delta and the long strikes at 15 delta away from the short strikes.
Long 1 put at 35 delta
Short 2 puts at 50 delta
Long 1 put at 65 delta
The backtester initiated one such butterfly trade each month from years 2017 thru 2019.
With 36 trades in those three years, it lost 31 trades and won only 5.
Clearly, just randomly putting on butterflies waiting till expiration without looking at the technicals of the market, not adjusting, and not having stop loss nor profit target is not going to work.
Adding Profit Target And Stop Loss
Now let’s tell the backtester to take profit at 20% of debit paid and exit trade at a stop loss at 20% of debit paid.
Running the same butterflies across that same timeframe, we now have a winning strategy with the following results:
Percent return: 25.3%
Win rate: 66.7%
Winning trades: 24
Losing trades: 12
Average win: $119
Average loss: ‑$91
Average loss to average win ratio: 0.76
Narrowing The Wings
What happens if we narrow the wings to 10 delta?
Long 1 put at 40 delta
Short 2 puts at 50 delta
Long 1 put at 60 delta
We get the following results:
Percent return: 10.4%
Win rate: 55.6%
Winning trades: 20
Losing trades: 16
Average win: $75
Average loss: ‑$45
Average loss to average win ratio: 0.60
The narrower wings decreased our percentage return, and therefore may be too narrow.
Wider Wings
If we widen the wings to 20 delta.
Long 1 put at 30 delta
Short 2 puts at 50 delta
Long 1 put at 70 delta
We get:
Percent return: 25.1%
Win rate: 66.7%
Winning trades: 24
Losing trades: 12
Average win: $166
Average loss: ‑$185
Average loss to average win ratio: 1.12
Wing width of 20-delta does not appear to be statistically significant to that of 15-delta wings.
Shorter Term Butterflies
What if we go with a shorter-term butterfly with 15 days to expiration? Keeping with the 15 delta wing width and running over the years 2017 thru 2019, we get the following results:
Profit target: 20%
Stop loss: 20%
Percent return: 10.6%
Win rate: 64.5%
Winning trades: 49
Losing trades: 27
Average win: $74
Average loss: ‑$109
Average loss to average win ratio: 1.49
Even though we do more trades, the percentage return is lower. While the shorter-term butterfly bring in more income from faster decay of short strikes, it has greater price risk.
Because of the increased price risk, would short term butterflies improve if profits were taken sooner? It did…
Profit target: 8%
Stop loss: 12%
Percent return: 22.3%
Win rate: 69.7%
Winning trades: 53
Losing trades: 23
Average win: $57
Average loss: ‑$75
Average loss to average win ratio: 1.32
Longer Term Butterflies
Using butterflies with 45 days to expiration, we get a negative result…
Profit target: 20%
Stop loss: 20%
Percent return: -11.6%
Win rate: 44%
Winning trades: 11
Losing trades: 14
Average win: $91
Average loss: ‑$143
Average loss to average win ratio: 1.59
To see if this is by chance, let’s do the same with 60 days to expiration:
Profit target: 20%
Stop loss: 20%
Percent return: 1.2%
Win rate: 66.7%
Winning trade: 12
Losing trade: 6
Average win: $104
Average loss: ‑$185
Average loss to average win ratio: 1.78
It is positive, but very low.
Even though the win rate here is the same as the 30-DTE.
Quite possibly the short strikes are not decaying fast enough to bring in income fast enough before price breaks out.
Varying The Stop Loss Level
Going back to the 30-DTE butterfly with 15-delta wings, let’s try varying the stop loss level while keeping the profit target at 20%.
With a profit target of 20%, setting the stop loss at 30% appears to be an in-between sweet spot with returns of 28.9%.
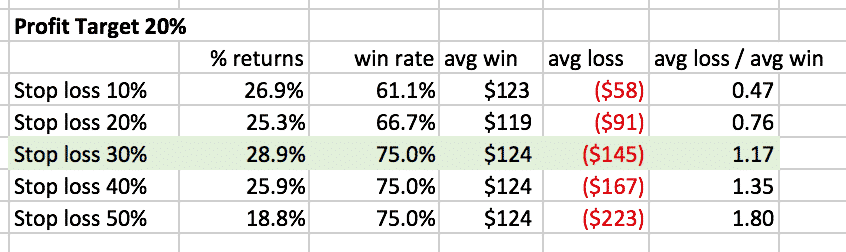
However, a larger stop loss means greater average loss per trade which means larger drawdowns.
Traders may need to adjust their stop loss based on their risk tolerance.
Taking Profits Earlier
How will returns be affected by taking profits earlier?
When taking profits at 15% the stop loss at 30% still appears to be ideal.

Taking profits earlier generally yields slightly lower returns.
Open Next Trade Immediately
So far in our example, we start each new trade at the end of the expiration cycle at the same time for each backtest.
But if we take profits earlier, the trade duration is shorter so that we can recycle the capital to use for another trade.
This time, we tell the backtest to initiate a new butterfly trade as soon as the current trade completes.
The results are quite different:
Having more trades does not necessarily mean that we get larger returns, especially if we open a new trade right after we’ve been stopped out.
Note that in this backtest where we have more butterflies being opened in possibly non-ideal market conditions, the optimal stop loss is lower than before.
Here a profit target of 15% and stop loss of 20% did the best resulting in a return of 1.9%.
When conditions are good for butterflies, a higher take profit level and larger stop loss is better.
When conditions are not so good for butterflies, take profits earlier and have a smaller stop loss.
Of course, it is difficult to know the market will behave after we place the trade.
Butterflies in Bear Market
As with any strategy, butterfly results are highly dependent on market conditions and entry criteria.
The years 2017 to 2019 was a bull market.
Next let’s see how butterflies do in a bear market of 2007 thru 2009.
If we run the 30-DTE butterflies from 2007 thru 2009 bear market (keeping same 15-delta wings and starting new trade at the end of the expiration cycle), we get the following results:
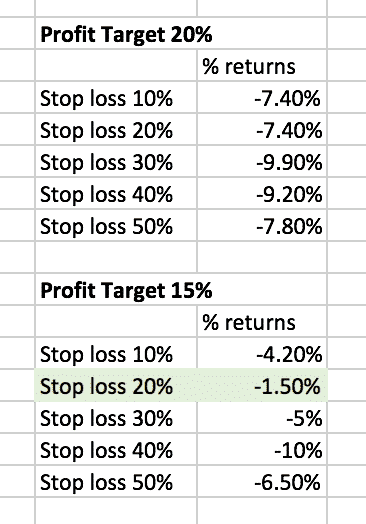
While under good market conditions a take profit level of 20% and stop loss of 30% was ideal, under poor market conditions a take profit level of 15% and stop loss of 20% performed the best.
Since we don’t know how the market conditions will turn out at the time of the trade, we tend to go with the more conservative 15% profit level and 20% stop loss in order to keep the drawdown small.
Technical Indicators
Even though butterflies are a directionally neutral strategy, the market condition and entry criteria makes a difference in the results.
2007 thru 2009 were not good years for butterflies.
If butterflies do better under certain conditions, then what are those conditions and technical indicators?
For example, adding a filter condition to say to trade only when VIX is above or below a certain level would change the results. Do butterflies do better in high VIX or low VIX?
Or what about doing butterflies only when the underlying is not overbought or oversold as indicated by the RSI being over 70 or below 30?
We’ll have to look into those in another article.
To run back tests like this, I use CML Viz, you can sign up for a discounted rate here.
Trade safe!
Disclaimer: The information above is for educational purposes only and should not be treated as investment advice. The strategy presented would not be suitable for investors who are not familiar with exchange traded options. Any readers interested in this strategy should do their own research and seek advice from a licensed financial adviser.


