Yield curves are something I like to keep a close eye on, particularly towards the end of a long bull market, as they are a great predictor of economic downturns. A yield curve refers to the difference in yields between long term and short term yields. The risk of default is greater over a longer period of time, so long dated bonds typically have a higher yield than shorter dated bonds frmo the same issuer (e.g. the US government). Occasionally, yield curves will “invert”, which is where short dated bonds have a higher yield than long dated bonds.
Normal yield curves (upward sloping, not inverted) as a sign of economic health. Banks can generate a profitable interest margin by borrowing at cheap short term rates and lending and the higher long term rate. This margin, encourages banks to lend and as such stimulates economic activity. When the yield curve inverts, banks will contract lending and economic activity will stall.
I don’t have empirical data, but when an inverted yield curve occurs, the majority of time a recession follows soon after. Cullen Roche from Pragmatic Capitalism noted the following in his June 2011 post:
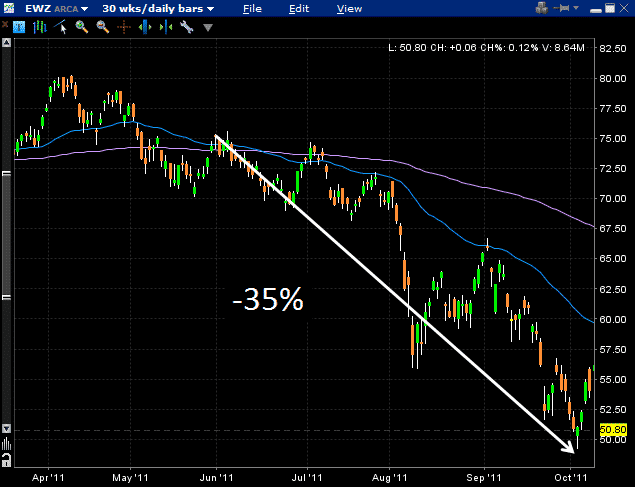
If you visit the post above, you will notice that the Brazilian yield curve was only 1 basis point from inversion as of May 31, 2011. Shortly after that time, I believe the yield curve did in fact invert, so let’s take a look at how the iShares MSCI Brazilian ETF performed after that time.
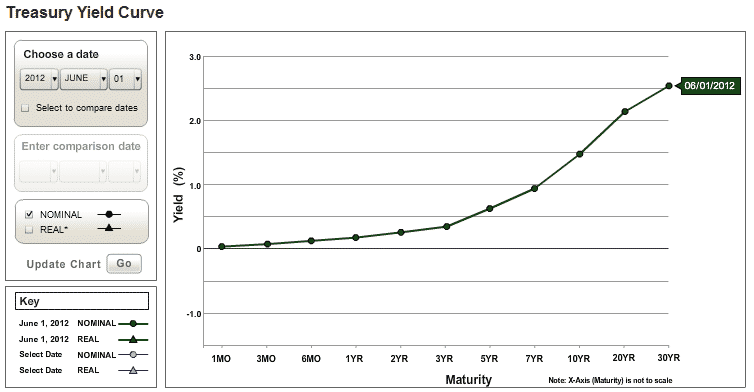
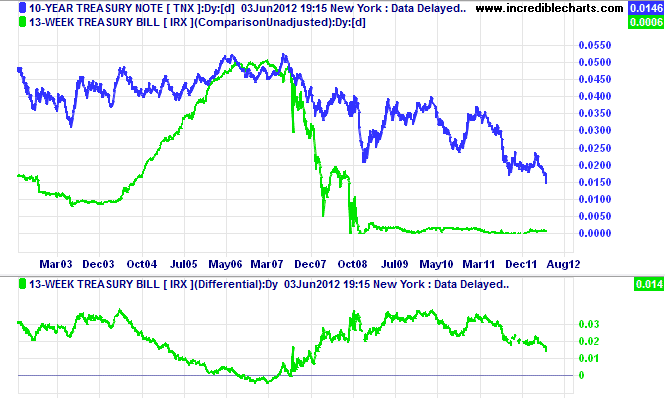
As you can see below, the US yield curve today is positively sloped, so that is a good sign for the economy. Generally, when a yield curve inverts, it is because of rising short term rates. However, in this current environment environment, short term rates are zero and likely to stay there for the immediate future. What is interesting however, is the fall in 10 year yields.
10 Year yields are at historic lows around 1.50% and as a result bank margins are going to be squeezed. The market seems to be cheering for the Fed to come to the rescue with QE3, but that will likely drive down the 10 year yield even further. In this fragile economic recovery, I don’t think we want to see another lending contraction which may well be an unintended consequence of QE3. So, think twice before you start cheering if Uncle Ben comes to the rescue as the long term consequences could be dire.
Data Source: US Department of Treasury
Data Source: Gold, Stocks, Forex


1 Comment