


Amazon, everyone’s market darling has once again had a blowout quarter and reported fantastic earnings. We’re talking revenue of $51.04 billion vs. $49.78 billion estimate and the big one – EPS of $3.27 per share vs an estimated $1.26.
Some of the numbers truly are staggering, including a 43% year-over-year increase in revenue and a 139% increase in advertising revenue.
No body wants to bet against this stock and for good reason.
Did you know, the last time AMZN touched it’s 200 day moving average was back in Feb 2016 when the stock was trading at around $550. Hard to believe really.
When Amazon peaked in November 2015 it was trading at $676, then dropped 30% to $474.
It came close to touching the 200 in November of 2016 and again in September of 2017. During those drops, the stock fell 16% and 13%.
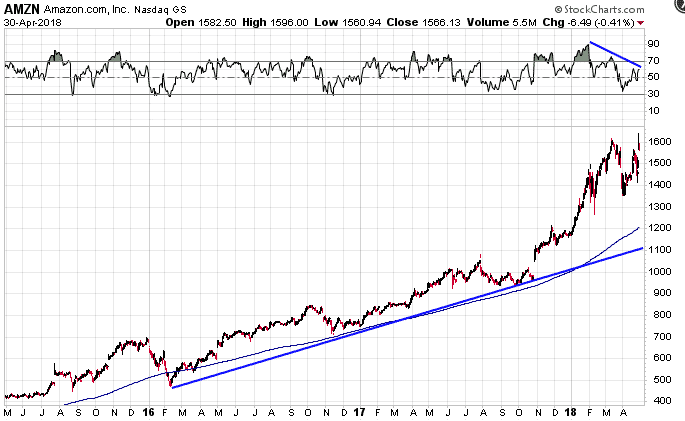
Looking at the chart above, Amazon is significantly above the trendline from the 2016 bottom, and is showing negative divergence.
I’ve said this numerous to my mentoring students. Stocks ALWAYS come back to the 200 day moving average eventually. It could happen in the next few months, it could take 6-12 months. It could happen with a short sharp 25% decline, or it could involve months of sideways action which the 200 catches up with price. But mark my words, at some point AMZN will touch the 200 day line again.
I said the same thing about Alibaba back in late 2017 at a time when no one was willing to bet against the stock. Since then BABA has traded sideways with quite a few big up and down moves, but sure enough it eventually touched the 200.
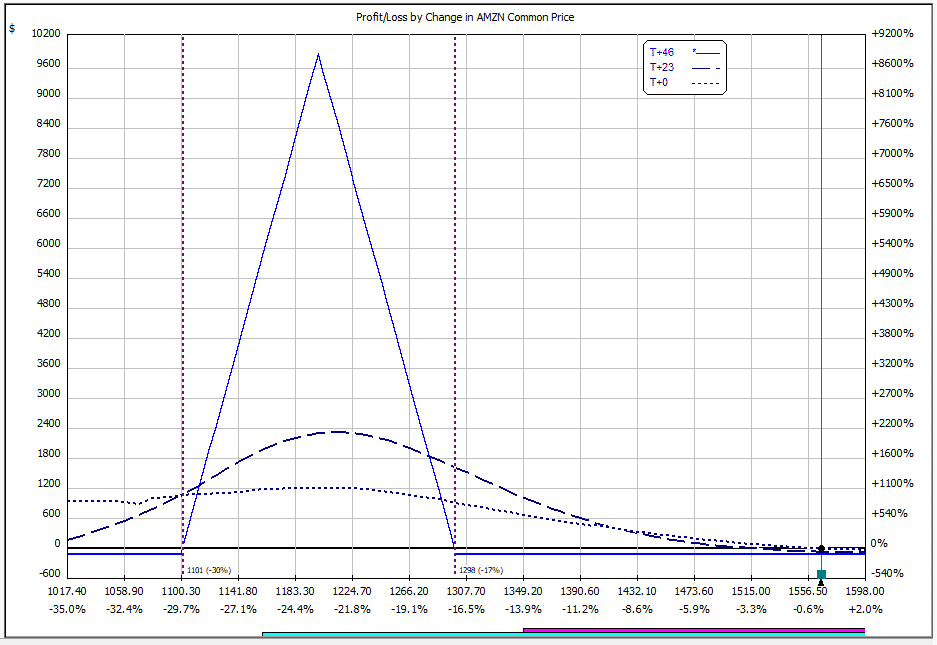
Amazon’s fundamental story is very strong but to me the technicals look concerning. It anyone’s guess which will win, but the beauty of options is that they allow you to express an opinion in a variety of different ways. It would take a brave man to bet against Amazon, but we could take a punt with a small amount of capital by using an out-of-the-money put butterfly.
Let’s say in the next 2 months we think AMZN is going to pull back close to the 200 day moving average. We could place a June 15th butterfly at 1100-1200-1300. That gives us a really wide profit zone around the 200 day line.
Because the butterfly is so far out-of-the-money, we can buy it pretty cheaply. The spread would currently cost around $100. Not bad for a trade with profit potential in the thousands.
In all likelihood, this trade will probably lose 100%, but I thought it was an interesting way to take a contrarian look at the strongest stock in the market. This butterfly trade could also be used as a hedge for those that have exposure on the long side but don’t want to sell their long-term position.
I’ll be sure to update you in a few weeks to let you know how this trade worked out.
Trade safe!
Disclaimer: The information above is for educational purposes only and should not be treated as investment advice. The strategy presented would not be suitable for investors who are not familiar with exchange traded options. Any readers interested in this strategy should do their own research and seek advice from a licensed financial adviser.


