





Have you ever owned a stock that just keeps going up and up and up?
It is not a bad problem to have, actually.
But there comes a point where you may worry that the stock has become overbought and could suddenly reverse, wiping out a large portion of your gains.
What can you do?
We will look at three ways and their pros and cons:
- The stock investor
- The option investor
- And the collar investor
Contents
Example
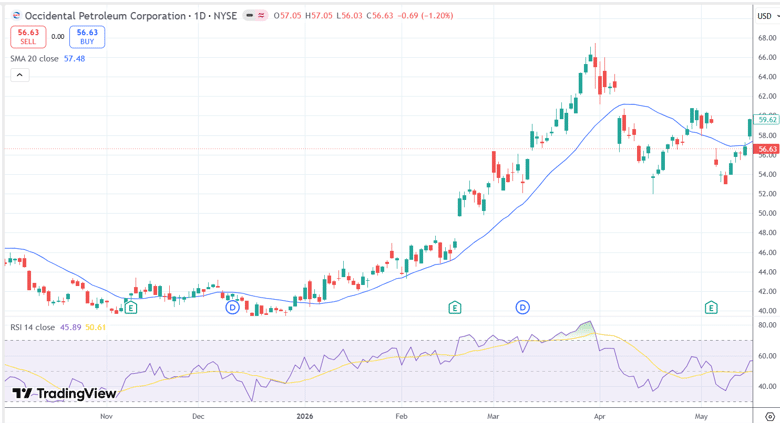
Let’s say that the three investors bought 100 shares of Occidental Petroleum (OXY) at $42.00/share on January 8th, 2026.
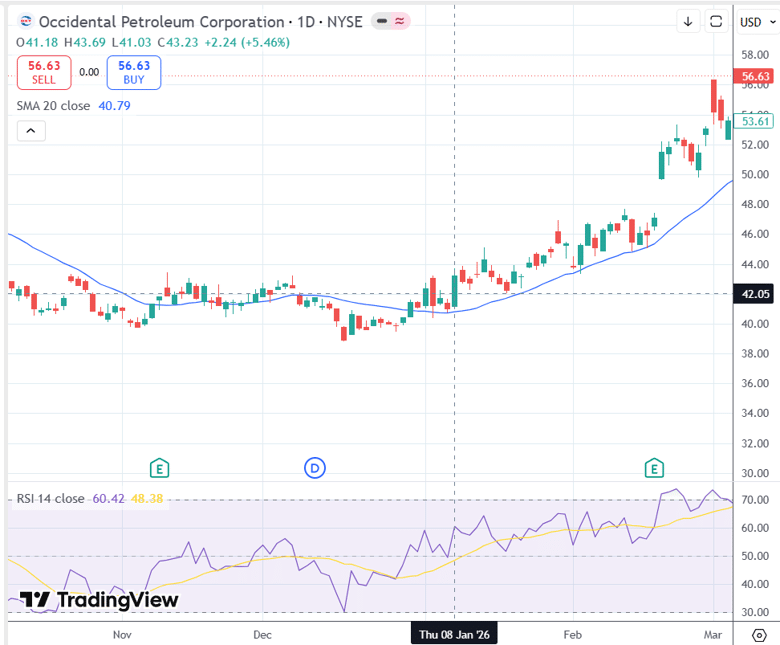
And on March 4th, it rose above $53.50/share, a 26% increase in two months.
The RSI above 70 is already showing an overbought condition.
A stock investor who strictly works with stocks may set a stop-loss order at $52.50/share.
At least now, if the stock drops below $52.50, he can exit at the market price near that level without participating in any further downside.
The option investor prefers to buy a put option, which establishes a guaranteed minimum selling price for the shares.
This provides downside protection if the stock declines.
She purchases a put option with a strike price of $52.50, giving her the right to sell her shares for $52.50 per share at any time before the option expires.
This put option, expiring 72 days later on May 15, costs $3.09 per share.
Since one option contract covers 100 shares, the total cost of purchasing the one put contract is $309.
Her P&L payoff graph looks like this with a max risk of $409…
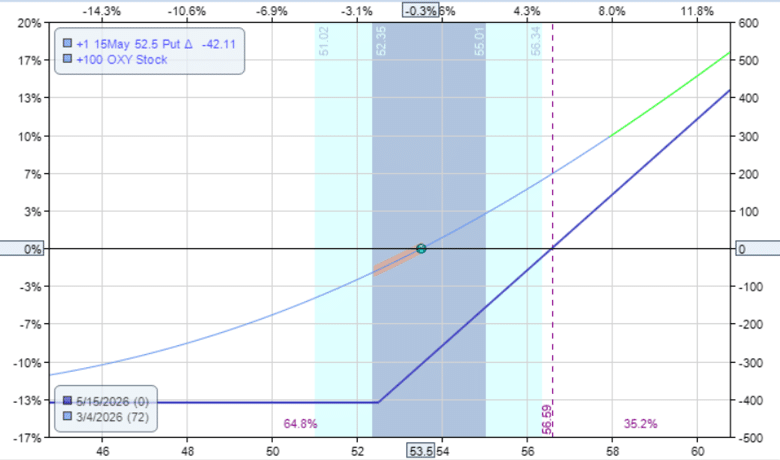
The maximum risk is determined by the difference between the stock price and the guaranteed exit price, plus the cost of the protective put.
Since the stock is trading at $53.50 and the put guarantees a sale price of $52.50, the stock position can lose at most $1.00 per share, or $100 on 100 shares.
Adding the $309 cost of the put option results in a maximum possible loss of $409.
So, how is this better than a stop loss, when a put option is so expensive and a stop-loss order costs nothing?
Stop-loss orders have a well-known vulnerability: they offer no protection against gaps.
If a stock closes at $53 and opens the next morning at $48 after bad overnight news, a stop at $52.50 does not fill at $52.50.
It fills at whatever the market price is when trading resumes, which could be considerably lower.
A put option, by contrast, guarantees the strike price regardless of how sharply the stock moves.
The solution is to finance the put by selling a covered call.
This is what the collar investor decides to do.
The premium collected from the covered call can help pay for the protective put, reducing or even eliminating the cost of the hedge.
He sells one call option with a strike price of $55 expiring the same time on May 15th.
He collects a $301 credit, which nearly covers the cost of the put option.
The resulting position payoff graph would look like this…
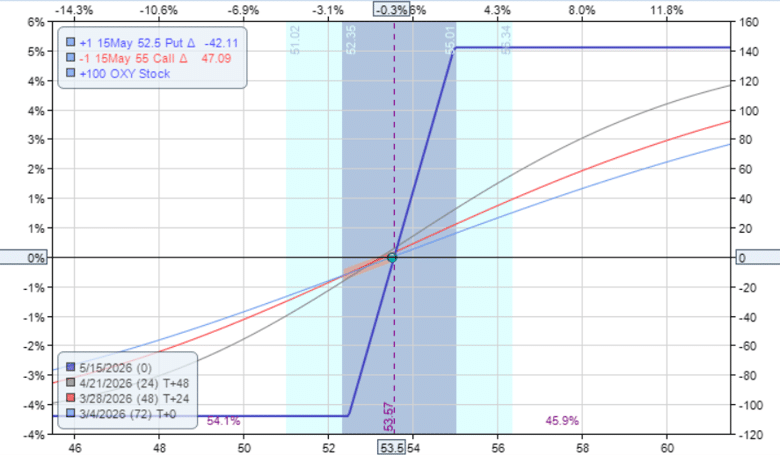
He has a maximum risk of $108 due to a potential drop in the stock price from $53.50 to $52.50, plus a net debit of $8 for the options.
One drawback is that selling the call limits your upside potential.
And the upside gains will not be as rapid as the other two investors.
Under certain configurations, the collar also creates positive theta, allowing the position to generate income over time.
This position has a very small positive theta of 0.10.
But as the price of the underlying moves up, the amount of theta will increase.
The option investor with only the put option has a negative theta.
Another advantage is that protective puts are not vulnerable to the same problem that often plagues stop-loss orders.
Many investors have experienced the frustration of watching a stock briefly dip, trigger their stop loss, and force them out of the position, only to see the stock quickly recover and continue higher.
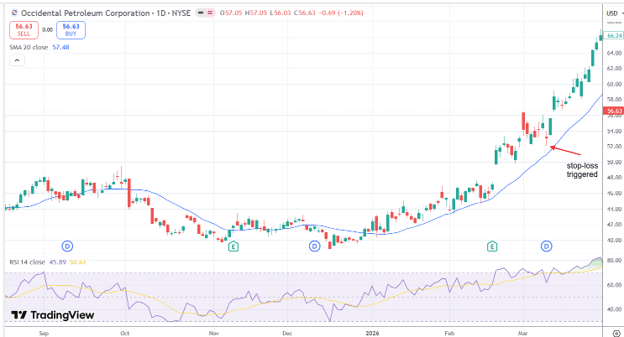
This was exactly what happened to the stock investor on March 10th, when OXY dipped below $52.50 intraday, triggering his stop-loss order and selling 100 shares of his stock.
A protective put avoids that issue.
If the stock falls below the put strike and later rebounds, you still own the shares.
Temporary price swings do not automatically remove you from the position.
You maintain ownership of the stock all the way until expiration.
The cost of that protection is the premium paid for the put option.
In this example, $309 for a 72-day put is roughly 0.6% of the stock value per month, comparable to an insurance premium on the position.
Traders who hold large concentrated positions in a single stock, or who have significant unrealised gains they want to protect going into a volatile period, often find that the cost is entirely reasonable.
If, at expiration, the stock is below the put strike price, the put guarantees that your shares can be sold at that strike price.
In effect, the put creates a floor under your position, allowing you to stay invested while protecting your gains from a major decline.
Now that the stock investor is out, let’s see how the option and collar investors fare as they continue to hold their positions.
On March 30th (about a month later), OXY rallied up all the way to $66/share.
The option investor’s position on March 30th shows a gain of $1043…
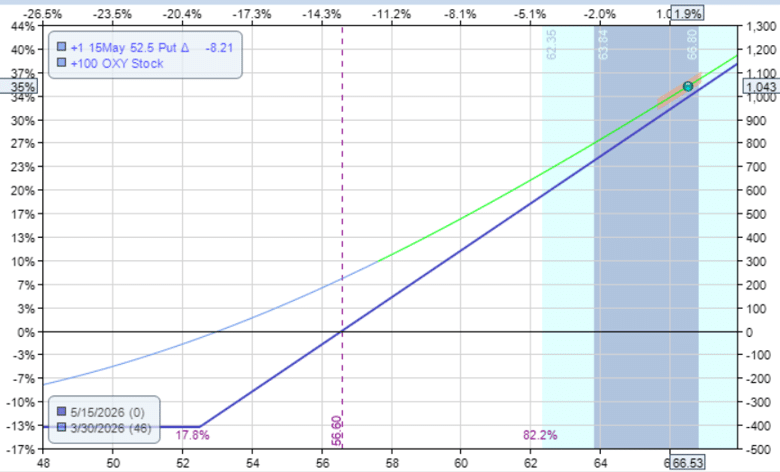
The return on capital usage is 18% in one month.
Because the capital used is the cost of the stock plus the cost of the put option:
$1043 / ($5350 + $309) = 18%
The collar investor position on March 30th shows a gain of only $89…
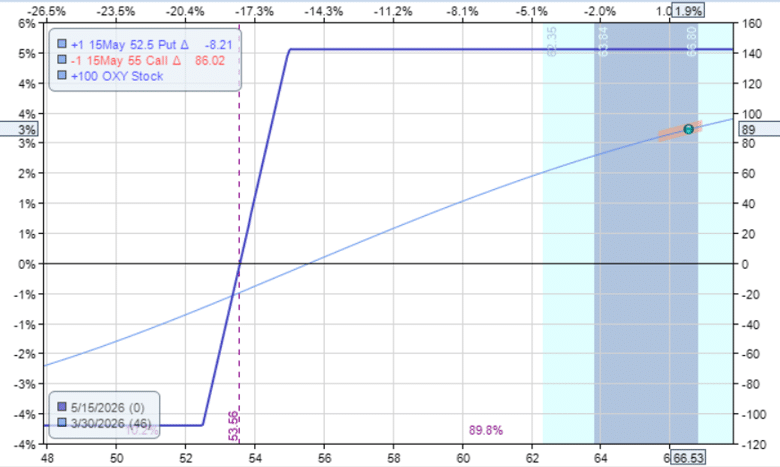
Return on capital usage is 1.6% in a month:
$89 / ($5350 + $8) = 1.6%
The large gap between the two returns reflects the core trade-off of the collar.
The option investor captured almost all of the upside from the $12.50 move in OXY, while the collar investor capped her participation at $55 (the short call strike) and then had to pay to roll that call higher when the stock blew through it.
The collar is cheaper to initiate but more expensive to manage when the stock moves sharply in one direction.
This dynamic explains why collar investors typically select short call strikes further out of the money when they expect continued upside, even if that means collecting less premium and paying more net for the hedge.
Strike selection on the short call is the most consequential decision in collar construction.
Setting it too close to the current price generates more premium but sacrifices most of the potential upside gain, while setting it further out reduces premium income but preserves more participation in the stock’s move.
Rolling The Put Option Up
The option investor has some decent gains.
To protect this gain, she rolls her put option up…
Sell to close May 15th OXY $52.50 put @ $0.49
Buy to open May 15th OXY $67.50 put @ $4.60
Net Debit: -$411
AFTER:
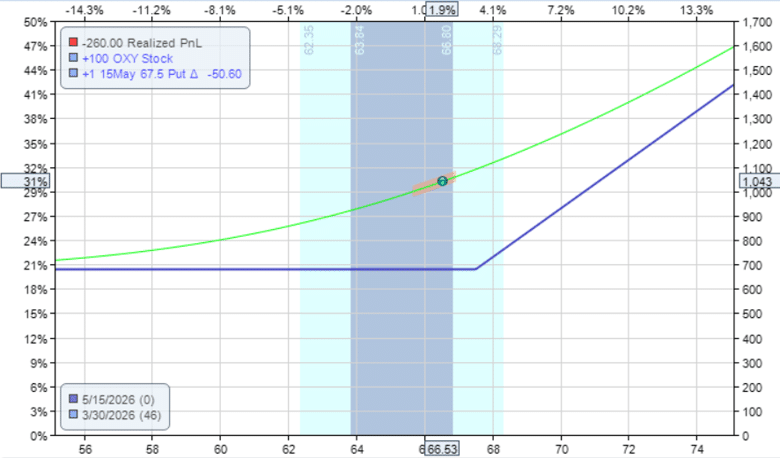
While she paid a debit for the roll, the adjustment locked in her profits so that if the worst happens, she ends up with a minimum profit of $680, even if the stock crashes.
Because…
Guaranteed minimum exit of $67.50 per share means a stock gain of $1400 for 100 shares:
100 x ($67.50 – $53.50) = $1400
Minus the cost of the put option: -$309
Minus the cost of the roll adjustment: -$411
So $1400 – $309 – $411 = $680
Rolling The Collar Up
The collar investor does similarly by rolling the collar up:
Sell to close May 15th OXY $52.50 put @ $0.49
Buy to open May 15th OXY $67.50 put @ $4.60
Buy to close May 15th OXY $55 call @ $12.55
Sell to open May 15th OXY $70 call @ $2.97
Net debit: -$1,368
AFTER:
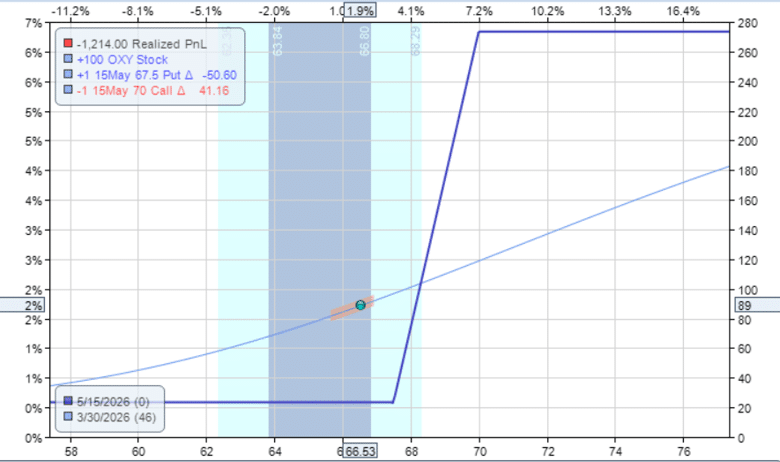
Also locked in some gains, but not as much as the option investor.
Guaranteed minimum exit of $67.50 per share means a stock gain of $1400 for 100 shares.
Minus the cost of the collar option: -$8
Minus the cost of the roll adjustment: -$1,368
Min profit = $1400 – $8 – $1368 = $24
At Expiration
On expiration May 15, OXY closed at $59.62, which is below the put option strike price of $67.50.
The put option is auto-exercised, and 100 shares of stock are sold at $67.50, and the call option expires worthless.
The P&L for the option investor is $680, or 12%, over 72 days.
The P&L for the collar investor is $24, or 0.4%, over 72 days.
The outcome illustrates a common experience with collars: the strategy works best when the stock moves modestly, staying within the range between the put and call strikes.
In that zone, both options expire worthless or near worthless, the investor keeps the stock gains, and the net debit of the collar is a small price to pay for the peace of mind of having the downside fully protected throughout.
When the stock makes a large directional move, as OXY did in this example, the collar constrains upside, while the protective put alone allows the investor to participate more fully.
Knowing which environment you are in before you enter the trade determines which structure is the better fit.
When selecting between these three approaches, your time horizon and tax situation matter as much as your market view.
The collar and protective put both require holding the stock through expiration to get the full benefit of the hedge.
If you plan to sell the stock before the options expire, the cost of the options may not be justified unless the protection covers a period of genuine concern, such as an earnings announcement or a macroeconomic event.
For investors with large unrealised gains who are concerned about capital gains taxes, the collar and protective put also serve a tax-deferral function.
Rather than selling the stock and triggering a taxable event, the investor can use options to lock in an effective exit price while delaying the actual sale to the following tax year.
This is a well-established use of collars in year-end portfolio management.
The RSI reading above 70 that prompted this analysis is worth contextualising.
Overbought conditions can persist for longer than expected, particularly in strong trending markets.
An RSI of 70 is a caution flag, not a sell signal.
Many of the most profitable stock moves happen precisely when the RSI appears stretched.
This is why the three strategies discussed here focus on preserving gains rather than exiting outright: they allow the investor to stay in the position while managing downside risk.
Summary
You could have argued that the stop-loss was too tight.
And you may be right.
Had it not triggered, the stock investor would have made $612 (because $5962 – $5350).
You could have argued that all three investors should have exited one month into the trade, on March 30th, rather than waiting until expiration, since the P&L was highest then.
And you would be right, in this case.
But it will not be like that all the time.
The investors had no way to know at the time that the stock was going to know to drop afterwards.
Timing the top is difficult and involves a bit of luck.
You could have argued that the covered call was sold too close to the money.
And you may be right, in this case.
The closer to the money at which the call option is sold, the more credit and less downside risk.
But there is less gain when the stock moves up.
The question is not which way is better, but which approach you prefer.
Depending on how the market responds, any of the three approaches could turn out to be the best.
If you’re serious about building an income-generating options portfolio:
Options Income Mastery: Learn the complete wheel strategy including covered calls, cash-secured puts, position sizing, and adjustment techniques for consistent monthly cash flow ($397)
The Accelerator Program: Advanced training covering portfolio-level management, multiple income strategies, systematic approaches, and professional risk management techniques for serious traders ($997)
We hope you enjoyed this article on protecting stock profits.
If you have any questions, send an email or leave a comment below.
Trade safe!
Disclaimer: The information above is for educational purposes only and should not be treated as investment advice. The strategy presented would not be suitable for investors who are not familiar with exchange traded options. Any readers interested in this strategy should do their own research and seek advice from a licensed financial adviser.