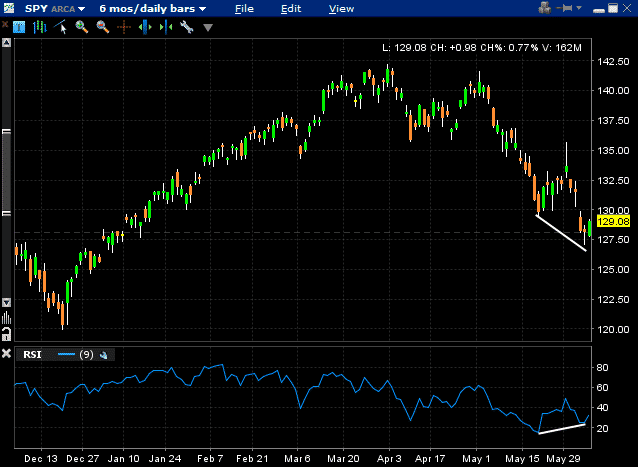
Noticing some bullish divergence over the last few days in SPY with the RSI indicator. Financials are also leading us higher, so this could be a good place to get long if you were looking for an entry point. However, considering the macro environment, I think caution is warranted.
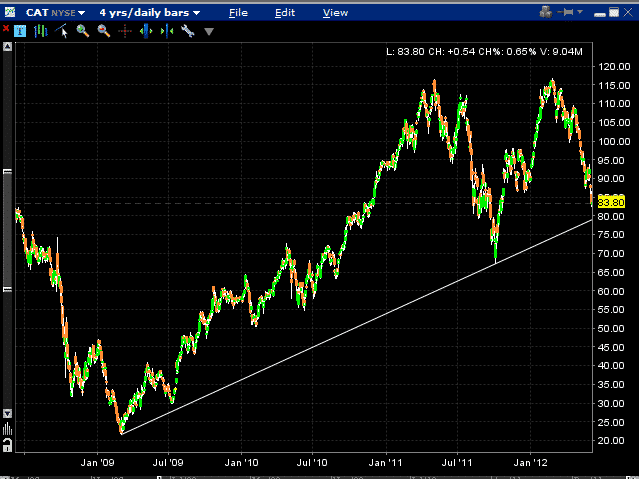
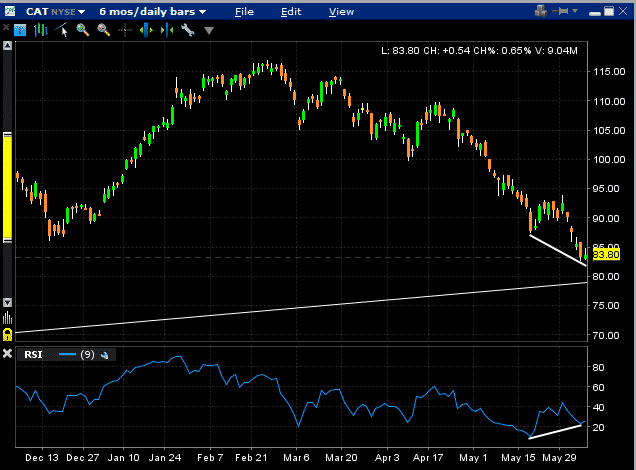
Another thing I am looking at today is the long term trendline in CAT. You can see that the line come in around $79 when drawn from the 2009 low. In the short term, there is also a bullish RSI divergence. If you wanted a bullish play on the stock you could set up a bull put spread below the long term trend line.
Sell 1 CAT $77.50 July 20th Put @ 2.54
Buy 1 CAT $75 July 20th Put @ 1.93
Net Credit Received = $0.61
Max Gain = $61 per spread
Max Loss = $189
Breakeven Price = $76.89
Return on Risk = 32.28%

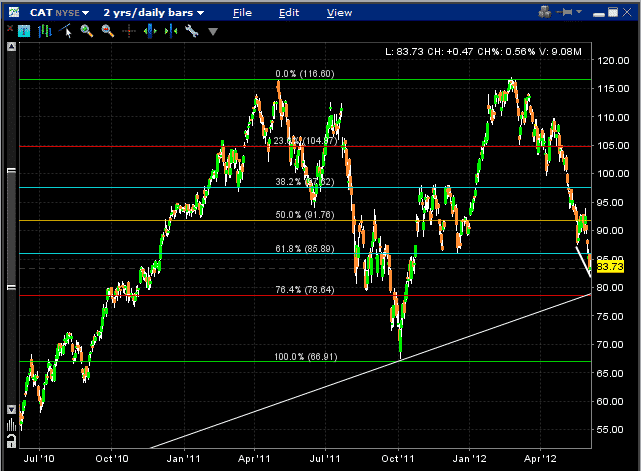
The long term trend line also ties in well with a key fibonacci level which gives it even greater weight in my opinion.
Don’t forget to sign up to the IQ Newsletter to be the first to be notified of new posts and trade ideas.


Totally agree with the CAT trade. Also note that earnings appear to be after July opex, so that won’t be an issue. I may end up following you in on this trade.
Yep, I tend not to trade individual stocks, expecially when earnings are due, but I may make an exception in this case.