


Here are some of the key charts I’m currently watching.
SPX / SPY
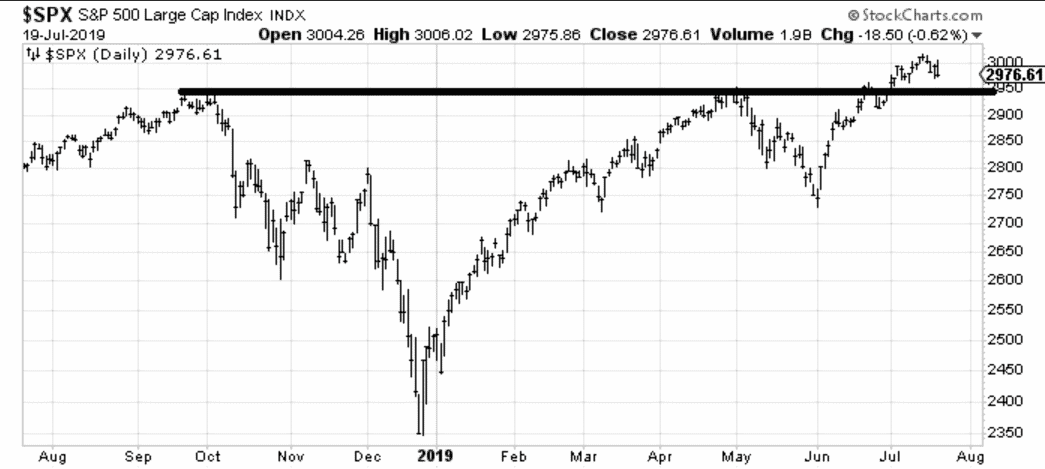
All eyes will be on the 2950 level this week, crucial for the bulls to defend this.
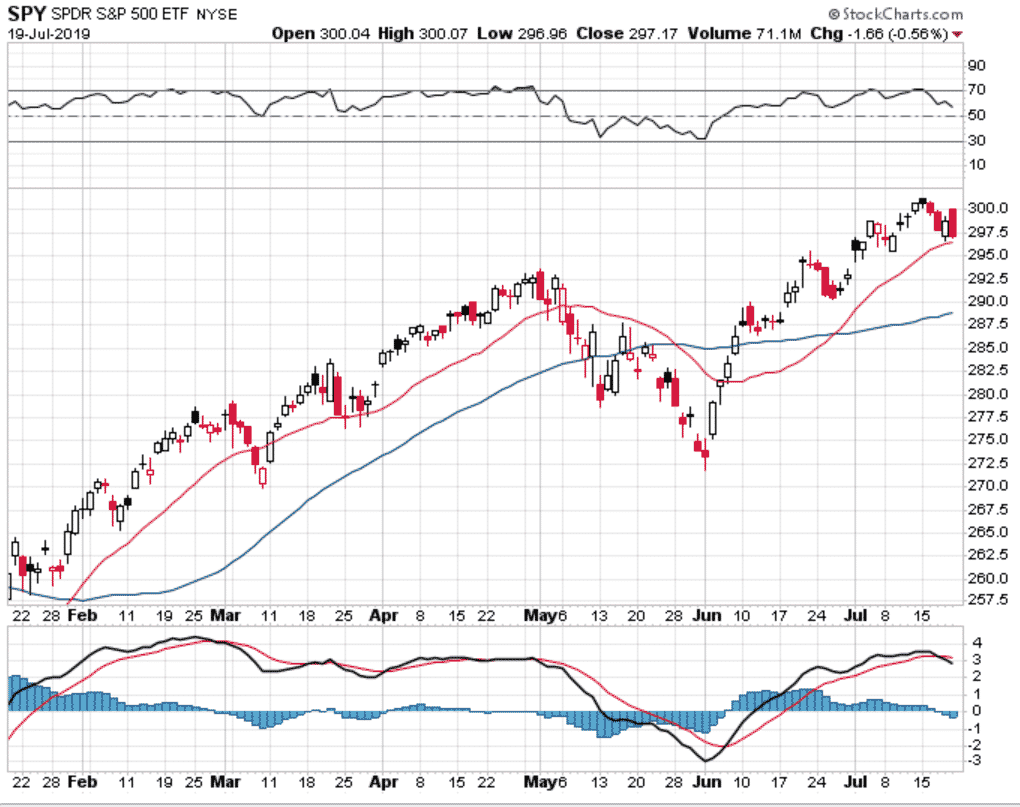
On the daily chart, keep an eye on the 20 day moving average. If SPY drops below that line and the line starts to slope downwards, that might be the time to reduce risk.
SEASONALITY
This time of year tends to be pretty weak for stocks.

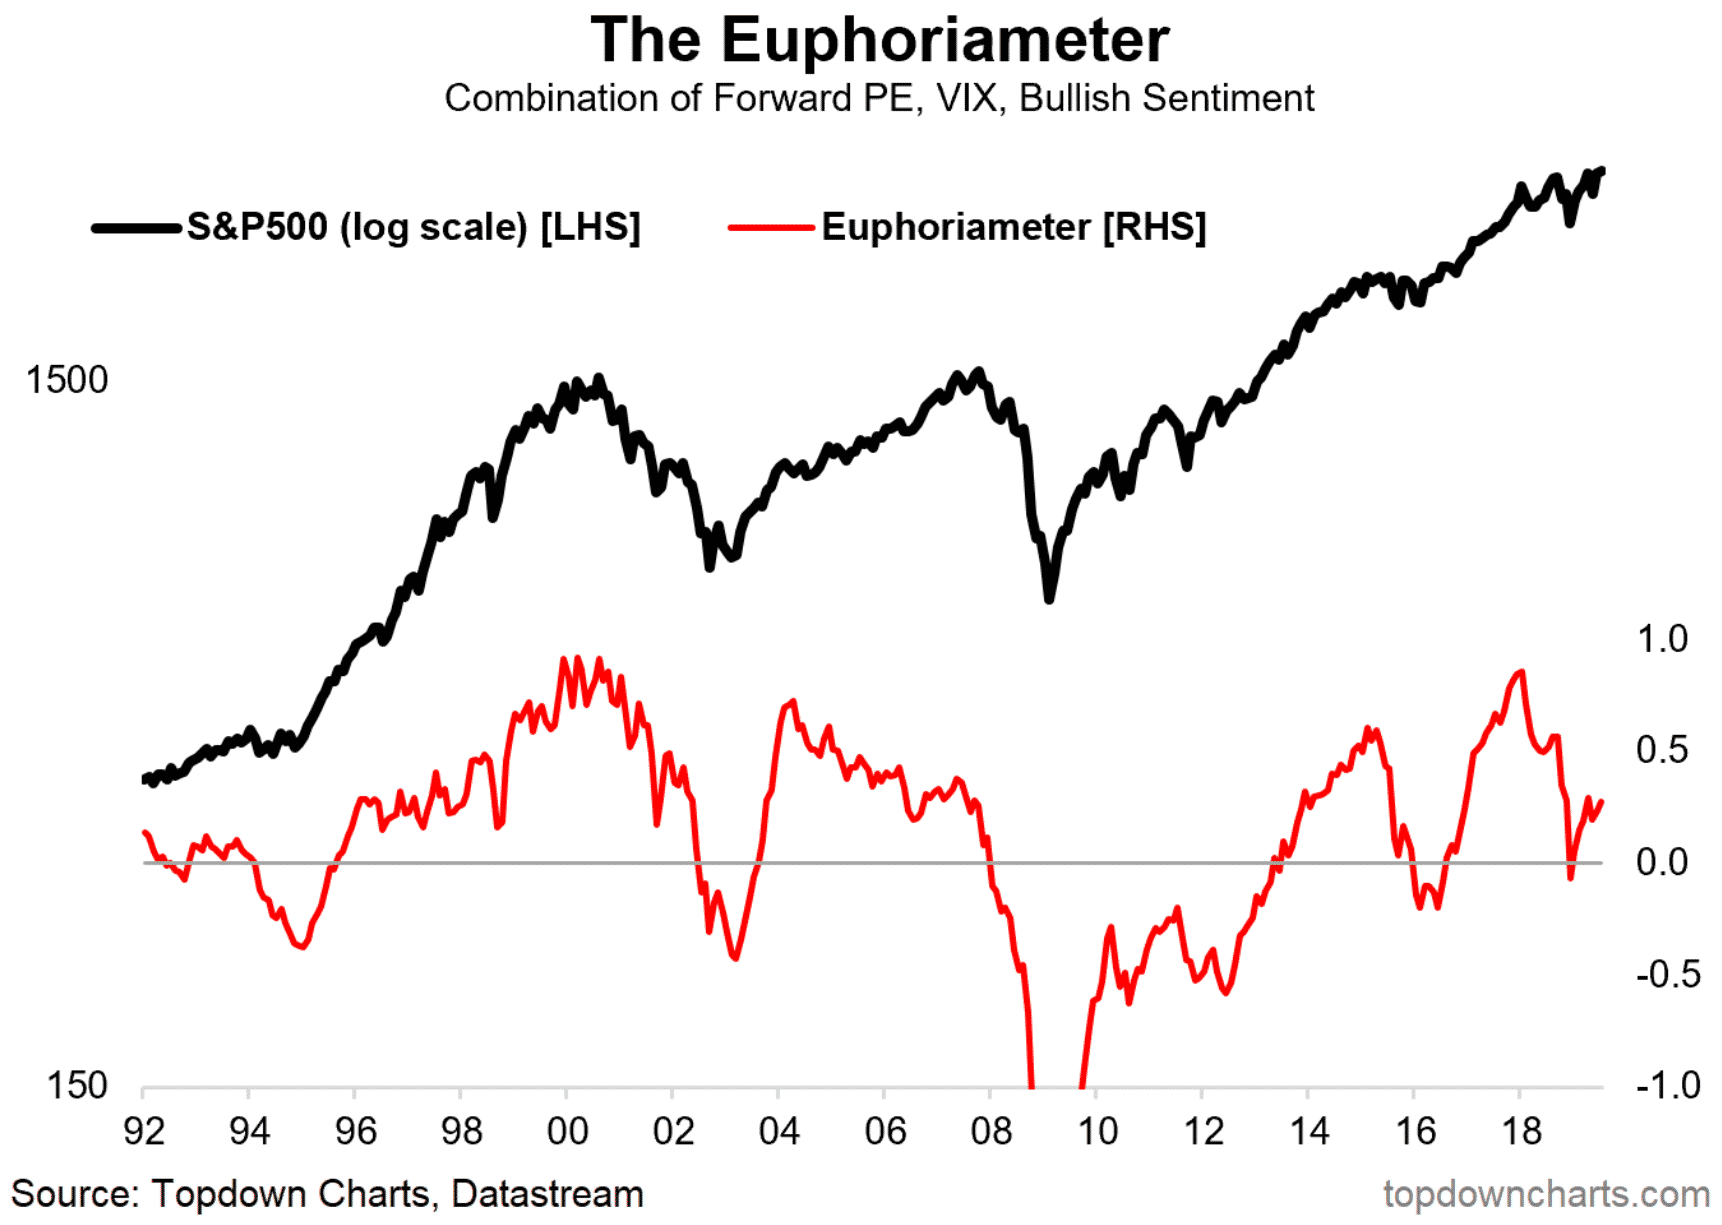
EUPHORIAMETER
Definitely not at an extreme level yet, so perhaps this bull has further to run.
ALLOCATIONS

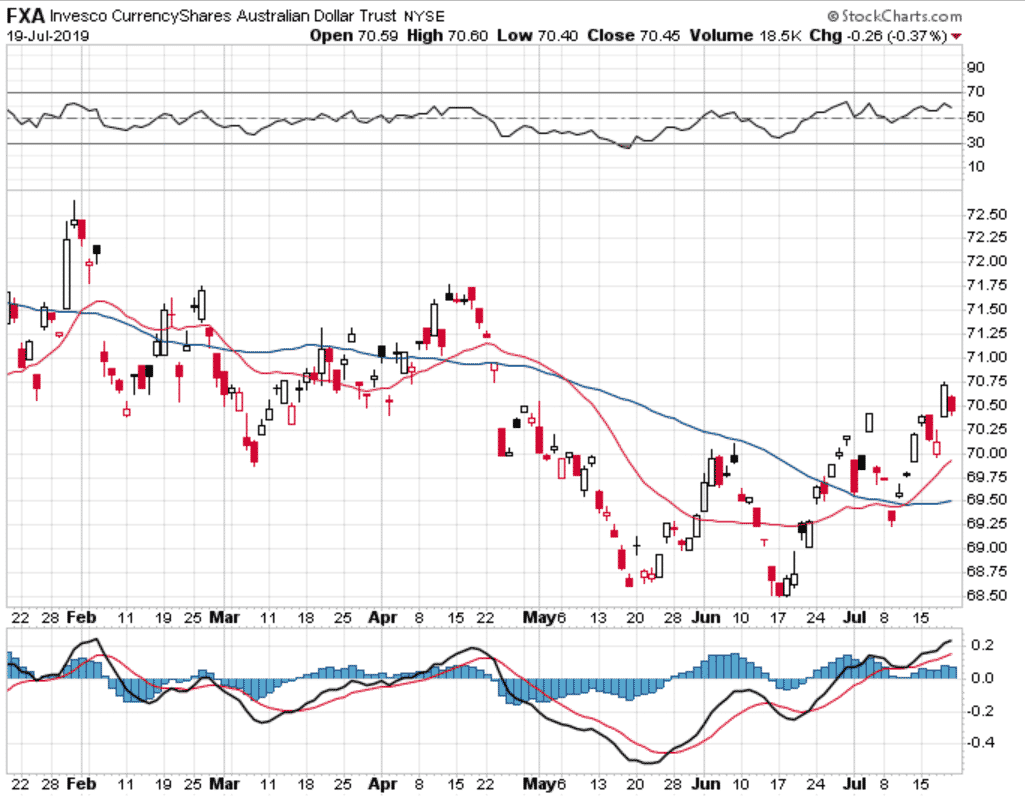
AUSSIE DOLLAR
After a tough run, the little aussie battler is looking a lot better. A nice series of higher highs and higher lows. Back above the 50 and 200 day moving averages and the 200 day is starting to flatten out and turn upwards.
SPX
Some potential moves this week.
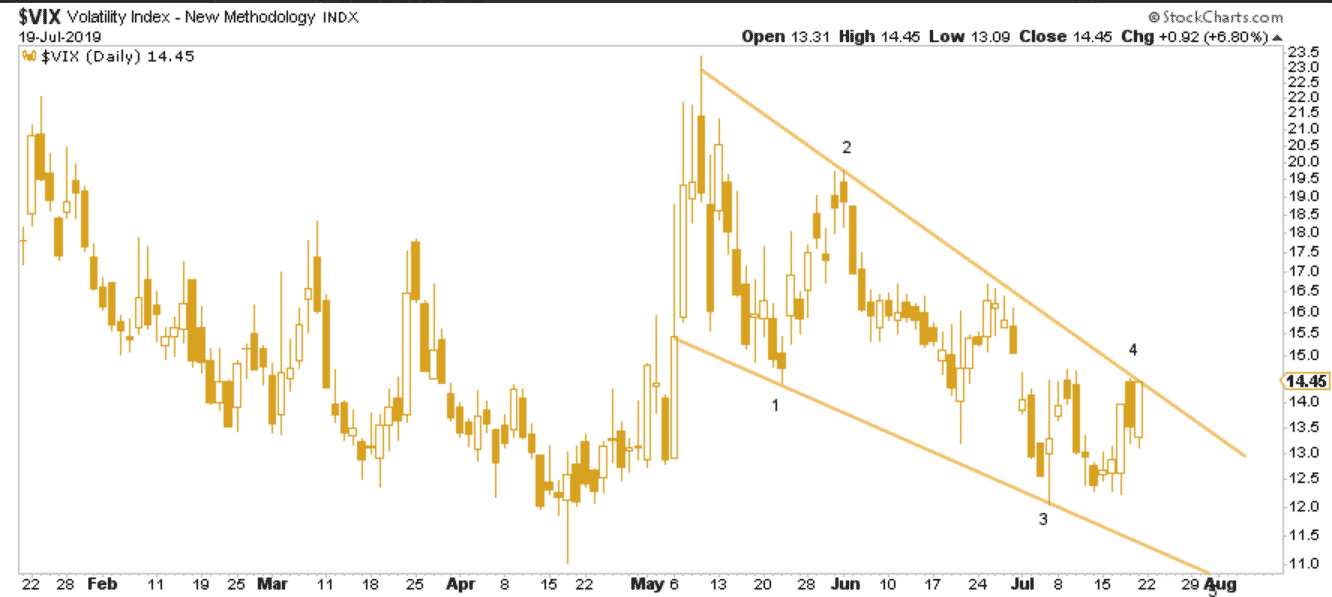
VIX
Trendlines to watch on VIX.
Click Here For My Top 5 Technical Indicators
If you’ve got any other charts of interest, let me know.
Trade safe!
Disclaimer: The information above is for educational purposes only and should not be treated as investment advice. The strategy presented would not be suitable for investors who are not familiar with exchange traded options. Any readers interested in this strategy should do their own research and seek advice from a licensed financial adviser.


