


Contents
- The Dividend Discount Model Overview
- The Dividend Discount Model Formula
- Dividend Discount Model Example
- Dividend Discount Model Calculator
- Dividend Discount Model Calculator – Verizon Example
- Conclusion
There are a lot of factors and potential strategies that can be used in order to determine what the value of a company is.
One such approach is named the Dividend Discount Model, which works on the basis that the current value of a business is equal to no more than the present value (value in today’s terms) of all future dividends.
The Dividend Discount Model provides investors with a relatively simple, but highly effective way to determine whether the current price of a stock is fairly valued or expensive/cheap.
This article will delve into what the Dividend Discount Model is, how it is calculated, suggestions for how best to apply it, and also includes a handy calculator for you to use.
The Dividend Discount Model Overview
Once a company has been consistently generating increasing profits, management may decide to start giving some of those profits back to the company’s owners (i.e. the shareholders).
While some companies may keep their profits to re-invest, eventually long-term shareholders will desire to get a return on their initial investment and they will push the company’s management to begin distributing profits.
Once a company decides to distribute profits to shareholders, they do this in a form called dividends, which are payments made to shareholders typically once every quarter.
In general, once a company starts paying dividends, shareholders expect these dividends to continue unless they were part of a special one-off dividend.
Over time, the owners also expect the dividend to increase as they assume that company profits will also increase over time.
Due to this dynamic, it is common for investors to value dividend-paying companies based on their expected future dividend payments.
Specifically, investors will apply a Dividend Discount Model which is a formula that allows investors to calculate the fair value of a company’s stock.
The Dividend Discount Model adds up all future income flows from dividend payments and determines what they would be worth in today’s money, to arrive at a final valuation of the company called its’ fair price.
The next section will explore the Dividend Discount Model formula in detail.
The Dividend Discount Model Formula
Before we begin, it is important to note that the Dividend Discount Model was designed to be used on companies that pay a high and regular dividend.
While each dividend doesn’t need to be for the same amount, provided dividends are being paid in some relatively consistent manner the formula can be applied.
If the company is not paying any dividends, nor is planning to in the near future, there is no value in applying this formula.
The Dividend Discount Model is built upon a financial process called discounted cash flow analysis.
Discounted cash flow analysis is the key method professional investors use to determine how much an investment is worth and is applicable whenever you are paying some lump sum of money today in the hopes of receiving money in the future.
Discounted cash flow analysis is based on the principle of the Time Value Of Money, which simply states that money today is generally worth more than money received at some time in the future.
For example, say you are able to earn a 10% return on your money over time and someone offered you the choice of either receiving $100 today or receiving $108 in a year from now.
Which would you pick?
To work out which is the better deal, we can apply the Time Value Of Money concept to determine which option gives us more money.
If we take the $100 today and invest it, assuming we can earn a 10% return, it means that in a year’s time we will have gained $10 in interest, for an end result of $110.
If we compare the $110 we would receive from taking $100 today and investing it, we can see that after a year we have more money than if we had taken the offer for $108 in a year’s time.
When we value a business, we’re essentially asking ourselves the same question – do I invest a lump sum today to earn interest (dividends) in company A, or am I better served by investing in company B, C, or D?
Discounted cash flow analysis uses the principle of Time Value Of Money to value a business by saying that for any investment, its value today can be determined by taking all of its future cash flows (specifically dividends) and discounting them to what’s called their present value.
The present value is simply the value of a future cash flow represented in today’s dollars.
Think about it in the opposite of the Time Value Of Money calculation we just did – instead of taking the current year’s amount of $100 and multiplying it by a 10% return, we take next year’s income of $108 and discount it by 10%.
If we do that, we arrive at $98.18 – this is what’s called the present value of the future cash flow of $108.
Again, we can compare the two offers – $100 today, or $108 in a year’s time, which is actually worth $98.18 in today’s dollars (present value).
When using the Time Value Of Money concept, it generally doesn’t matter whether you bring future cash flows back to the present, or take present cash flows and project them into the future – the concept works the same.
However, for the Dividend Discount Model it is important to know that the discounted cash flow it’s based on pulls future cash flows into the present, so make sure you apply this consistently.
In the previous example, we had a simple scenario with only one future cash flow.
In reality, we’ll rarely want to discount just one future cash flow, so we need a formula for calculating multiple future cash flows.
The discounted cash flow is represented as follows: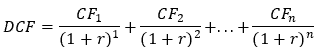 Where:
- DCF is ‘Discounted Cash Flow’ and is equal to the sum of all of the future cash flows discounted to their present value.
- CF is ‘Cash Flow’ and is equal to the total cash flow for a given year (e.g. CF2 is the total cash flow for year two).
- r is ‘Discount Rate’ and is equal to your targeted rate of return for the investment.
- n is the number of periods you have in scope.
A cash flow can be either positive or negative, indicating an income or expense.
Since we’re dealing with dividends however, the cash flows will always be positive as we will be paid dividends by the company.
In terms of the discount rate, it is up to the individual investor to choose what is the appropriate amount.
Generally speaking, investors will approach the problem of choosing a discount rate by determining how much they’re willing to be compensated for the risk of making the investment.
Typically, this involves taking the current ‘risk-free’ rate is and then adding some sort of premium to account for the added risk that they’re taking to make this investment compared to earning the ‘risk-free’ rate.
An investor might choose to use term deposit rates or more often government bonds as the ‘risk-free’ rate, as a government that prints its own currency technically cannot default on its debts.
For example, say government bonds were returning 1% and an investor would like to earn a 5% premium for taking on the risk of investing in a company’s stock.
Therefore, the discount rate they would use is 6% – made up of the 1% ‘risk-free’ rate, and the 5% risk premium.
In some cases, the discount rate can also be based on additional hurdles, such as the cost of using borrowed money.
Now that we know the discounted cash flow formula, to get to the Dividend Discount Model all we need to do is to simplify some of the math and introduce a new variable called the growth rate: Where:
- FP is ‘Fair Price’ and is what the fair price of a company’s stock will be, based on future dividends.
- D1 is the estimated dividend per share for next year.
- r is ‘Discount Rate’ and is equal to your targeted rate of return for the investment.
- g is ‘Growth Rate’ and is equal to the estimated long-term average annual dividend growth rate.
This is the basic Dividend Discount Model, sometimes named the Gordon Growth Model after its’ creator Myron Gordon.
The main thing to remember with the Gordon growth model is that it assumes that dividend growth will be constant over time.
The key problem with using the Dividend Discount Model is that it requires an investor to make plenty of assumptions about what future dividend payments will be, even when applied to ideal candidates that have steady and reliable dividend payments.
Since it relies on an investor’s assumptions about growth rates, estimated dividends and discount rates, it suffers from the ‘garbage in, garbage out’ issue, where the results will only be as good as the initial assumptions taken when using the formula.
The main assumption of the formula is that dividend growth will remain steady when in practice this is unlikely to be the case.
To get around this, and make the model a little closer to reality, you can apply a multi-stage model.
A multi-stage model merely assumes that dividend growth will be different during different phases of the company’s life and so the formula is changed to reflect this: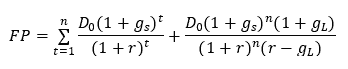 where:
gs is the expected dividend growth rate in the first period.
gL is the expected dividend growth rate in the second period.
The formula for this gets quite cumbersome to work out manually as it requires you to calculate the present value of each individual cash flow for each future period.
Using an automated calculator can help speed up the process – see the Dividend Discount Model Calculator section below for further detail.
We’ll now go through a worked example of the Dividend Discount Model which assumes a constant growth rate.
Dividend Discount Model Example
Say you have some money to invest in your favorite company, but it’s recently gone up considerably as a result of good news and you’re no longer sure if the current price is a fair price to pay.
Since the company pays dividends and has released dividend guidance, you decide to apply the Dividend Discount Model.
You look into the company financials and you discover that it is expected to pay a dividend of $1.65 per share next year.
Reviewing your risk profile, you determine that the minimum return on your investment will need to be 12% a year for you to be comfortable to invest.
Finally, the company has a history of increasing dividends by 7% per year and you believe this is likely to continue going forward.
Recall that the formula for calculating fair price is: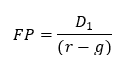 Your inputs would therefore be as follows:
D1 = $1.65 (Next year’s dividend)
r = 0.12 (The desired 12% return on investment in decimal form)
g = 0.07 (The forecast 7% annual dividend growth rate)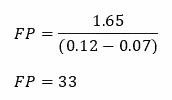 This result means that for you, a fair price of the company’s stock would be approximately $33.
If the price was below $33 it would mean that the stock is underpriced and may represent a bargain, while a price above $33 would signify it is overvalued.
In practice, when using the Dividend Discount Model you should aim for a margin of safety, to protect you against unforeseen events.
So if we follow from the previous example where the fair price is $33, you might consider taking 10-20% off or more from the target price as a margin of safety.
The main disadvantage of the Dividend Discount Model is that the outcome is extremely sensitive to changes in dividend growth expectations.
For example, in the worked example we had a 7% dividend growth rate – if that grew by just 1% to 8%, fair value would rise to $41.
Conversely, if the dividend growth rate fell by just 1% to 6%, the fair value would fall to $27.5.
That represents a difference in the fair value range of $13.5 for just a 1% difference in dividend growth rate!
Since it’s highly unlikely you’ll be able to accurately predict the dividend growth rate, it may seem like it’s not a worthwhile formula to use.
That is not the case, provided you use it for very specific applications.
For example, the Dividend Discount Model should not be used for moderate or fast-growth companies.
Instead, the model should be applied to companies that are likely to experience low growth, but pay high dividends.
Examples of this might include utility companies, large banks, and Real Estate Investment Trusts (REITs).
When a stock has a lower dividend yield (say less than 3%), with a lower estimated dividend growth rate (less than 2%), it is a lot less likely to have a wide range of dividend growth rates.
The other factor to consider is that in most cases, as companies grow and take up an increasing amount of market share, the pace of growth begins to slow down.
This results in revenue growth stabilizing, which leads to a slower, but more stable growth in dividends.
To account for this, you can apply the multi-period Dividend Discount Model across two stages – one which considers a high dividend growth stage followed by a period of a lower dividend growth rate.
Recall the Dividend Discount Model formula for multi-periods:
Say you wanted to work out the fair price of a company with a dividend of $25 and you assumed it had a 2% dividend growth rate for three years, followed by a 0.5% dividend growth rate thereafter.
You have also worked out your discount rate to be 18.5%.
The formula would end up being: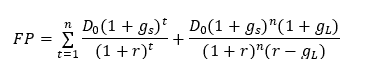 Your inputs would be as follows:
D0 = $25 (This year’s dividend)
r = 0.185 (The desired 18.5% return on investment in decimal form)
gs = 0.02 (The forecast 2% annual dividend growth rate for period 1 in decimal form)
gL = 0.005 (The forecast 0.5% annual dividend growth rate for period 2 in decimal form)
Plugging these values in we get: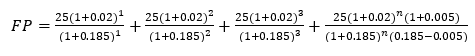 Deciding what n should be will be based on how far past the three years you’d like to forecast dividends for.
Provided your discount rate is greater than your dividend growth rate, as n increases, that section of the formula gets smaller (since the denominator will be greater than the numerator).
Since you’re likely to use this equation multiple times in different contexts, it’s much easier to make use of a calculator such as the one described in the next section.
Dividend Discount Model Calculator
Since it can be cumbersome to manually calculate the Dividend Discount Model (particularly for periods with different dividend growth rates), we’ve developed a handy Excel-based calculator you can use.
The calculator features two sections – one that calculates the Dividend Discount Model based on the Gordon Growth model, while the other allows you to calculate the Dividend Discount Model based on multiple periods with two different growth rates.
Let’s say you’re looking to work out what the fair price of a stock is with a consistent dividend growth rate of 2%.
You’ve set a target discount rate of 18.5% and have worked out that company dividends are $25 a year.
To solve this in the calculator, navigate to the section in blue which is the Gordon Growth based Dividend Discount Model.
There are a number of sections highlighted in orange, which are used for user inputs.
If you enter the required details, the calculator will automatically determine the answer, which in this case is $151.52.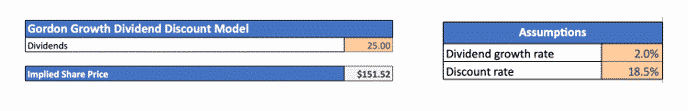 This can be useful as a quick sense check or ‘back of the envelope’ calculation, but if you’re after something a bit closer to reality, you’ll need to use the multi-period calculator.
Imagine now, that you want to expand on the previous example with a lower dividend growth rate of 0.5% after three years.
Navigate to the multi-period navigator which is in green and fill out the assumptions table:
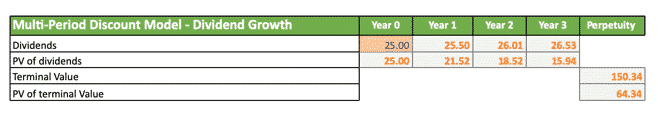 Next, enter the dividends of $25 in Year 0 under the ‘dividends’ field.
There’s no need to enter anything in the grey boxes – the handy calculator will do all the heavy lifting for you.
The results will be calculated and displayed under the ‘implied share price’ section, which in this case equals $145.32.![]() You can see how a drop in dividend growth after year three has an impact on the fair value price – dropping from $151 to $145.
You can see how a drop in dividend growth after year three has an impact on the fair value price – dropping from $151 to $145.
Dividend Discount Model Calculator – Verizon Example
Now that we have an understanding of the Dividend Discount Model and how to use the calculator, let’s apply it to a real stock – in this case Verizon Communications (VC).
Let’s say we’re interest in finding out whether VC’s stock price of $54.30 at the close of Tuesday 26th May 2020 represents a fair price.
Looking up the company financials, we have the following data:
- The forecast dividend growth rate is 2.15% (based on the growth rate over the past three years)
- Next year’s dividend is forecast to be $2.46
We will assume a risk premium of 6% above the ‘risk-free’ rate for the risk of investing in stocks.
As the ‘risk-free’ rate we will use the 10 year government treasuries as a basis, which was 0.69% as at Tuesday 26th May 2020.
Together with the 6% risk premium, our discount rate becomes 6.69%.
Plugging these values into the the calculator we get: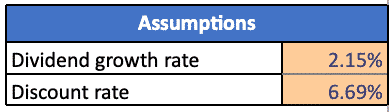
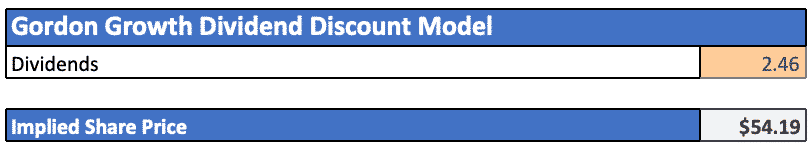 The fair price we get from the calculator is $54.19, slightly below the current price of $54.30.
This indicates that the current price is fair, given the current level of dividends and associated dividend growth.
This is unsurprising given its a defensive stock with high dividends, trading close to its average price over the past year.
However, if it were to fall lower as it did during the COVID crash to $51.80, it would be considered to be almost 10% below fair value and represent a good buy with some margin of safety.
Conclusion
A Dividend Discount Model is a useful way for investors to quickly determine what the fair value of a company’s stock price is, based on an estimate of future dividend growth.
It leverages the principle of Time Value Of Money, which states that future cash flows are worth less than a lump sum today.
The Dividend Discount Model works by finding out the present value of future cash flows, by discounting them against a discount rate, and factoring in dividend growth.
The simplest model is the Gordon Growth Model, which assumes constant dividend growth.
However the likelihood of dividend growth staying constant is small, so for a more accurate view, it is best to use a multi-period model with the help of a calculator.
The Dividend Discount Model works best for stocks that are likely to experience low growth and pay high dividends consistently.
This includes stocks such as large banks, utilities, and Real Estate Investment Trusts.
Since moderate and fast-growth companies are likely to experience rapid changes in revenues and dividend payouts, it’s best to avoid using the Dividend Discount Model in those instances.
The major flaw of the Dividend Discount Model is that it is highly sensitive to changes in the assumption for future dividend growth.
Even small changes of 1% can result in large variations for fair value pricing.
As a result, the Dividend Discount Model is best used in conjunction with a margin of safety – for example, setting your target to be 10-20% off or more from the fair value price.
Trade safe!
Disclaimer: The information above is for educational purposes only and should not be treated as investment advice. The strategy presented would not be suitable for investors who are not familiar with exchange traded options. Any readers interested in this strategy should do their own research and seek advice from a licensed financial adviser.


I have.an even better approach u might be intersted in but it would be better to write it up and send it to you. I think we r. Similar in how we view the world
If u agree let me know so i dpnt waste my time doing a intellectial full Moimtie
Hi Mike, I’m always interested in new ideas and ways of looking at things, so yes I would be interested in discussing this further.
What is the opposite of the dividend discount model? For example, I have started down the road of reaching the mechanics of buying leaps of 2 to 5 years and how to determine if a price I have targeted to achieve will hit or what I will most likely do is buy a deep in the money strike, which at that point I would be concerned that the premium cost + the strike price will make the option worth trading. Is there a respected model to use?
Not sure Bob. Could you try reverse engineering the DDM?
HI. Thanks for all the education you post. This is interesting. However, the link to download the Excel calculator is broken. How can i get that file?
On top of that. There was a Beta Calculator mentioned in a different section. When I went to download it, I got a link, bu the link was to a “Put Selling Strategy.”
Hi Charlie, thanks for letting me know. It should be fixed now, and I have emailed you the files.