Bootcamp Day 1 – Greeks and Greek Ratios
I hope you enjoyed yesterday’s session on Greeks and Greek Ratios.
Heaps more good stuff to come over the next few days and today, I want to talk to you about technical analysis, which is usually everyone’s favorite topic.
Attached you will find a list of my Top 7 Technical Indicators. Have a read through and get familiar with these as we will be referring back to these a lot in future.
In addition to technical indicators, here are some of the other things I keep an eye on:
USING MULTIPLE TIME FRAMES
When monitoring the market, it is a good idea to check the charts on multiple time frames.
First, start with the monthly and weekly charts to determine the long term trends and check for any major overbought or oversold extremes.
Then, work down through the daily chart and even the 30 minute chart if entering short term trades.
Try to match the chart with the time frame you are trading. If trading weekly options, there isn’t much point checking the monthly chart. Check the 30 minute chart instead.
Likewise, if trading longer term strategies, such as covered calls, the weekly chart is more relevant than the 30 minute chart.
MOVING AVERAGES
Moving averages are one of the most widely watched technical indicators. They can quantify trends and create signals for entries, exits and stop losses.
The main moving averages that traders watch are the 5, 10, 21, 50, 100 and 200 day moving averages.
I tend to watch the 50 and 200 the most.
SIMPLE RULES FOR MOVING AVERAGES
When the 50 day moving average is rising = bullish
When the stock is above the 50 day moving average = bullish
When the 50 day is above the 200 day = bullish
You can use similar rules for any moving average.
Another popular rule is:
When the 5 day is above the 21 day = bullish
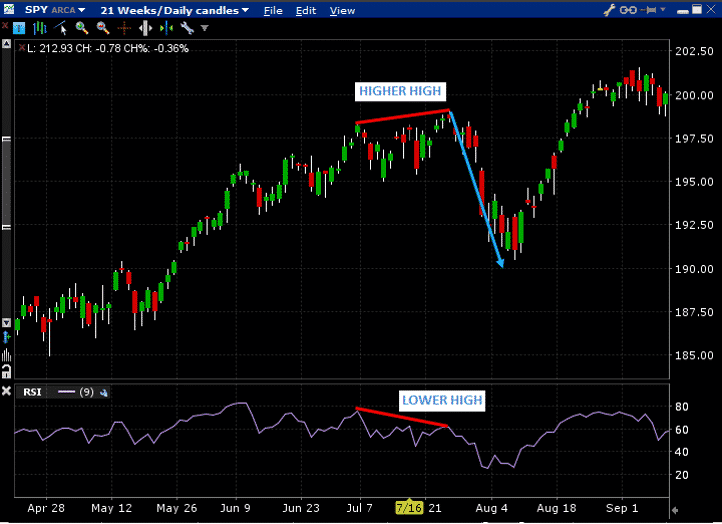
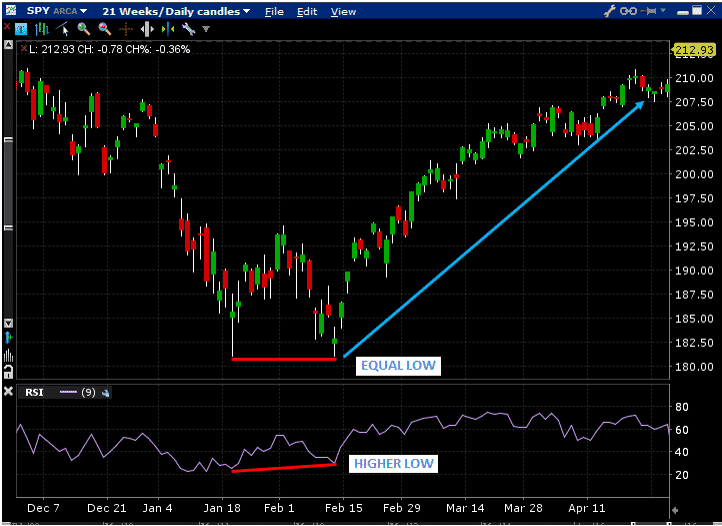
DIVERGENCE
Divergence occurs when price “diverges” from an indicator.
For example, the stock makes a lower low and the indicator makes a higher low. This is a bullish divergence.
Or, the stock makes a higher high, but the indicator makes a lower high. This is a bearish divergence.
Divergence can also be price making an equal high, but the indicator making a lower high.
Below you will find two great examples of divergence in action.
Stayed tuned for tomorrow lesson when we will cover how to manage an options portfolio. Lots of fun stuff coming your way. I’m excited, are you?
Trade safe,
Gav.